

Managing and Visualising
Large BNG Datasets
The Canal and River Trust’s Ecological Data Hub for managing BNG operations
The Vision
As part of the Canal and River Trust’s ambitious goals for increasing biodiversity across the canal network, EcoSpatial were contracted by the Canal and River Trust to calculate its biodiversity baseline. This included the processing of network wide survey data to meet the Defra 4.0 metric standard and statutory metric standards, and to visualise this data in a clear and accessible format. In the long term, this GIS tool must enable the Trust to identify statutory Biodiversity Net Gain (BNG) and other ecological funded projects, store information in relation to the status of these projects and allow relative changes in biodiversity to be fed back into the baseline.
Introducing the Ecological Data Hub
The Ecological Data Hub (ED Hub) is a pioneering application that utilises GIS as a tool for environmental management and visualisation. The overall aim of this project was to map the whole of the Trust’s network to establish a biodiversity baseline, and introduce a method to identify, log and track projects to improve the quantity and quality of biodiversity including statutory BNG.
Data Processing
Ecological survey data and predictions were provided with UK Habitats ID, habitat condition, and associated photograph. Using the ESRI Suite, around 115,000 survey points 35,000 survey lines and 160,000 polygons were processed to reflect the Biodiversity Metric 4.0 GIS data standard, and to provide the overall baseline BNG calculations. The baseline was then visualised using Experience Builder, which allowed for a dashboard functionality and user-friendly experience that allows any user to understand the habitat, hedgerow and watercourse baselines, but also to query the data to support future decision making.


The Quick View Map
From the Quick View Map the user can filter the baselines by Local Planning Authority (LPA), Trust operational boundaries, Country, and Local Nature Recovery Strategy (LNRS) area. The filtered data can then be exported in a csv format, or as a pdf map. The user can also view the attribute table and pan on the map when selecting a unique identifier.

Baseline Dashboards
The baseline dashboards, show a central map and accompanying functions. The list on the lefthand side show the total value of biodiversity units for all the broad habitats across the Trust’s network, while the item details shows the individual attribute details for individual polygons. In addition, picture attachments are linked to particular survey points across the network and show in the bottom right corner of the dashboard. The total number of biodiversity units across the Trust can be seen underneath the central map, with filters that highlight the areas with the highest value, and lowest condition. By adding these filters, the user can see which have the highest potential biodiversity unit value for banking, and habitats with poor condition that present an opportunity for enhancement. The same spatial and attribute filters can be applied as the Quick View Map, the dynamic text reflects any filter changes, and the user can create charts that can be used in presentation material.


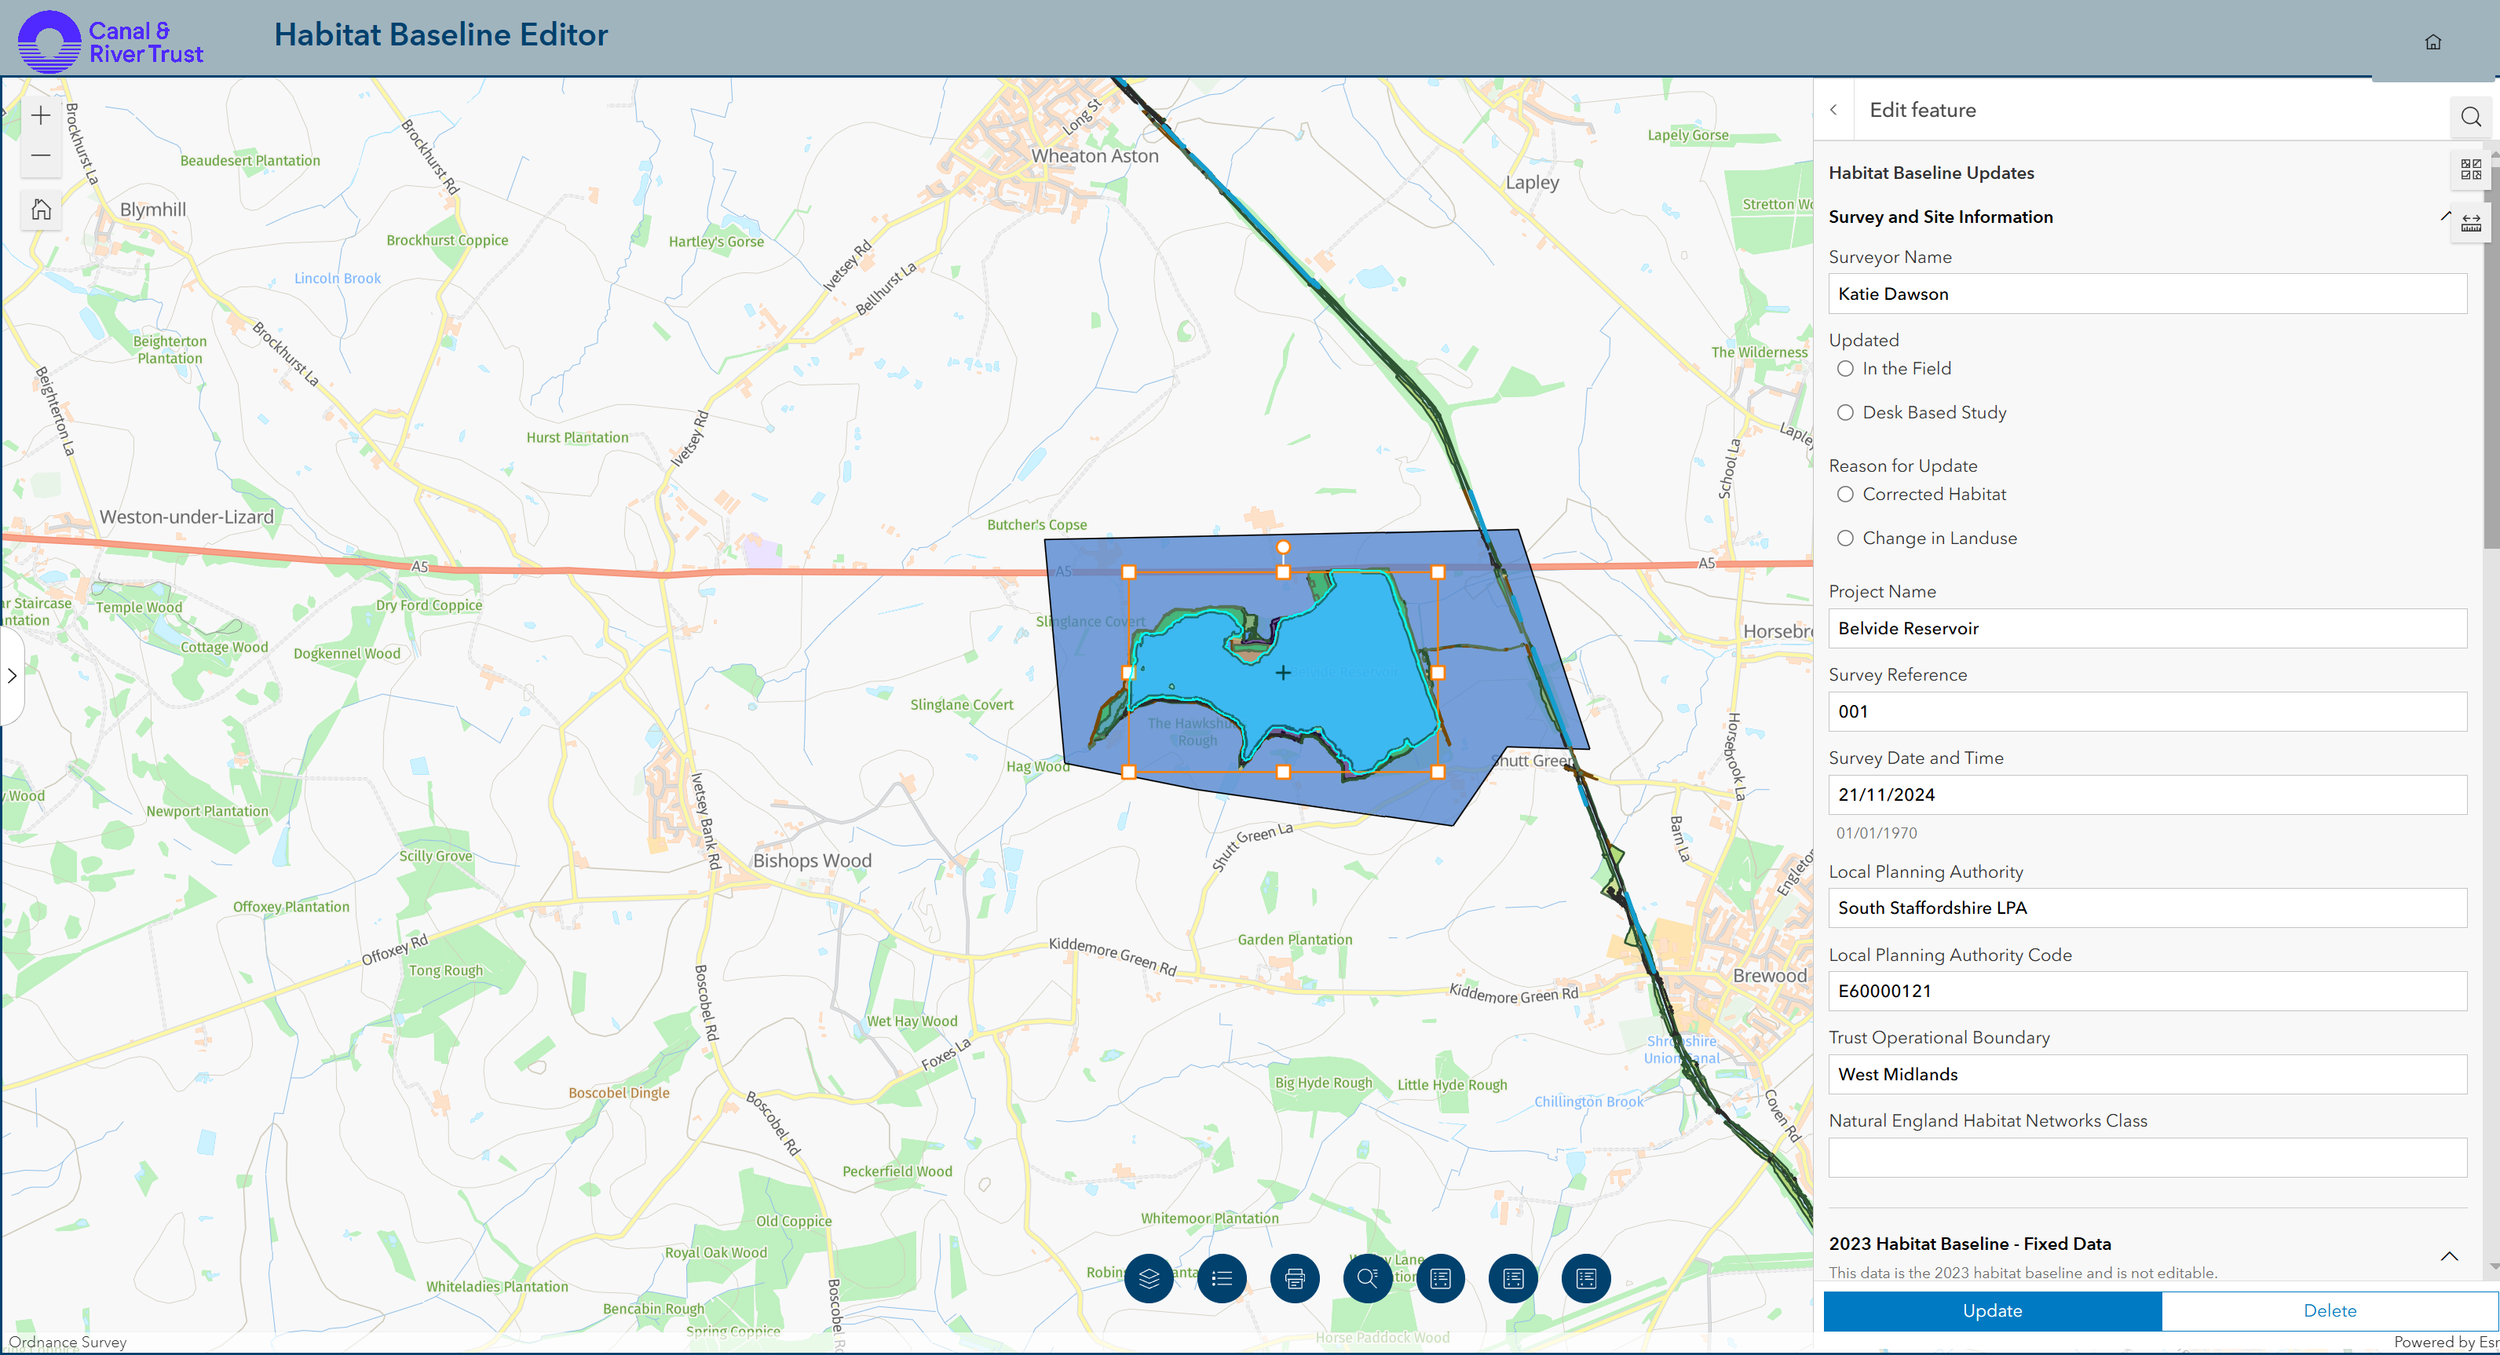
The Smart Editor
The data collection phase of the ED Hub required the creation of an ecological survey template system usable both via the desktop and via mobile devices for those out in field. It had to capture any new ecological surveys undertaken across the network to ensure improvements and losses against the baseline can be accurately reported within strategic accounting. It is essential for producing new baseline reports specific to externally funded agreements e.g., BNG. The majority of BNG assessments come down to the judgement of the ecologist. They’re only human, but the mistakes can affect the dataset. Using ArcGIS Field Maps, we have created a survey system that auto-populates to reduce the amount of manual inputs from the ecologist. We have used various pre-existing data including trust specific data, and open source data. All calculations which have all been configured correctly for each different habitat type. The ecologist has all calculations, including condition score and overall BNG unit score completed for them, they simply need to submit their update.

Benefits
Using the ED Hub ensures the Trust complies with the biodiversity metric 4.0 by generating consistent and well-managed data.
As a single source-of-truth for all biodiversity baselines, this reduces uncertainty and allows different departments to export data that meets environmental reporting needs.
The interactive platform allows users to query the data to find suitable BNG units based on size, location and landownership type.
Housing all information within the ED Hub reduces the need for users to move between multiple software, such as excel, when querying baseline data. Baseline data can be further edited and updated as users continue to survey.
The smart editor in the ED Hub allows the Trust to maintain and evaluate changes without the need to re-survey the whole network in the future, with restrictions that ensure the correct users can edit.
In addition, the use of calculated expressions and conditional visibility in Field Maps allowed for the survey to be customised so the correct habitat condition survey is visible, and the intense calculation of condition is automated, eliminating human error.
The opportunities this offers to support decision-making are considerable. Analysis of new and existing survey data can inform decisions, meaning BNG is integrated into the design process and changes can be made to optimise outputs early. This ultimately engages the Trust in the nature recovery network to become more biodiverse by 2037.