

The Community Mapper
Welcome to the Community Mapper, an interactive platform designed to empower communities, enhance green spaces, and improve accessibility through crowdsourced data and collaborative mapping. This solution combines multiple tools to help identify issues, map local knowledge, and analyse urban infrastructure for better decision-making. See more information below.
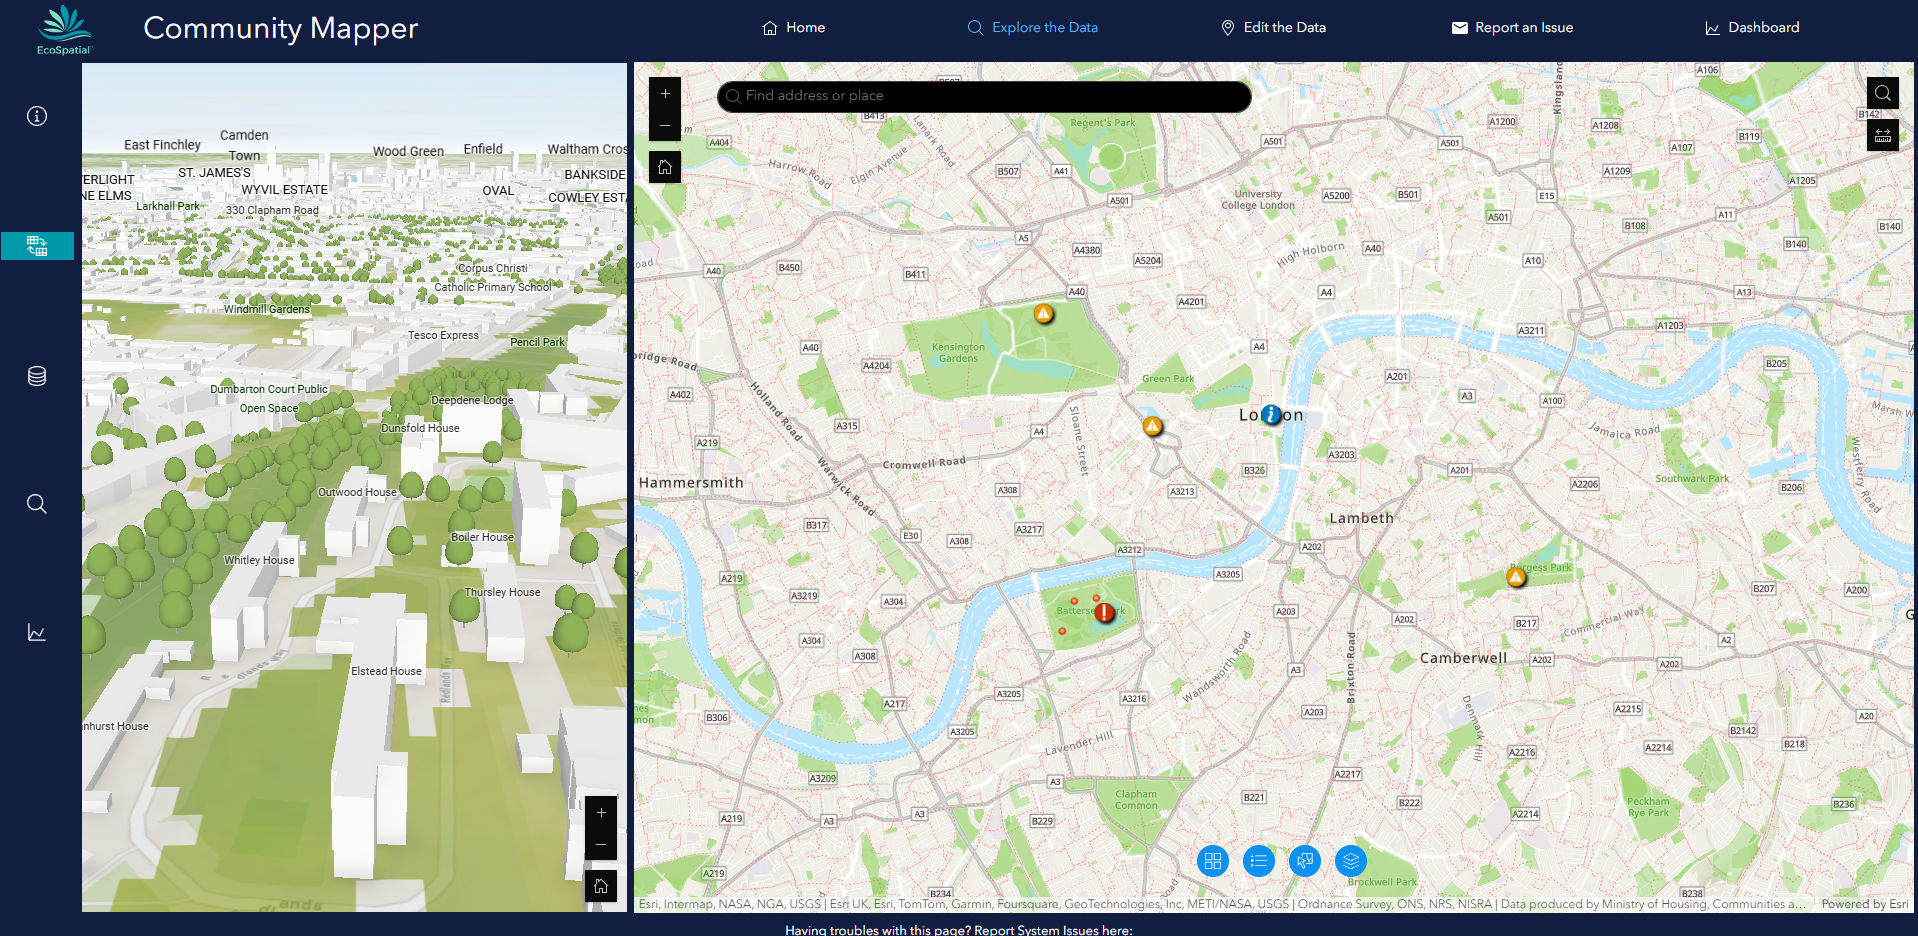
The Explore the Data section is the main interactive map where users can visualise community-reported issues, environmental data (like tree canopy cover and deprivation indices), and community contributions. With both 2D and 3D views, it provides a comprehensive understanding of the local environment, allowing users to explore spatial relationships and trends.
Add new features (points, lines, or areas) to the map, such as trees, benches, or accessibility improvements.
Edit and update existing features to keep information current and accurate.
Upload photos to provide visual context for mapped features.
Use filters to view specific contributions, such as green spaces or accessibility features.
Explore a community-driven map that highlights positive changes and local initiatives.
View community-reported issues and mapped features alongside environmental data layers.
Switch between 2D and 3D views to explore tree canopy heights and urban greening opportunities.
Use layer toggles to control the visibility of data like IMD scores, 3D trees, and accessibility features.
Apply filters and search tools to focus on specific locations, feature types, or issue categories.
Click on features to view detailed pop-ups with descriptions, photos, and status updates.
The Community Mapping tool enables users to add positive features to the map, such as newly planted trees, accessible pathways, or local amenities like benches and bike racks. This tool fosters collaborative mapping, allowing the community to showcase improvements, share local knowledge, and highlight ongoing projects.

The Report Issues tool allows community members to easily submit reports about missing green spaces, accessibility barriers, or public service gaps. Using a simple form, users can pinpoint issues in their neighbourhoods, describe the problem, and upload photos. These reports feed directly into the interactive map for review, action, and tracking.

The Dashboard offers real-time data visualisation and analytics to help users understand the scope and impact of reported issues and community contributions. It provides charts, graphs, and heatmaps that reveal patterns and trends in urban greening, accessibility, and public services. This tool is essential for decision-makers and researchers looking to prioritise interventions and track progress over time.
View real-time statistics on the number and types of issues reported.
Explore heatmaps that highlight areas with concentrated reports or environmental challenges.
Analyse trends over time to identify recurring issues or areas of improvement.
Compare environmental data (like tree canopy cover) with socioeconomic indicators (like IMD scores).
Track the resolution of reported issues and the progress of community initiatives.
Submit reports on issues like missing trees, inaccessible paths, or lack of public amenities.
Pinpoint the exact location of an issue on the map.
Provide photos and descriptions to support your report.
Track the status of your report as it moves from New → Under Review → Resolved.
View other community reports to identify shared concerns in your neighbourhood.
